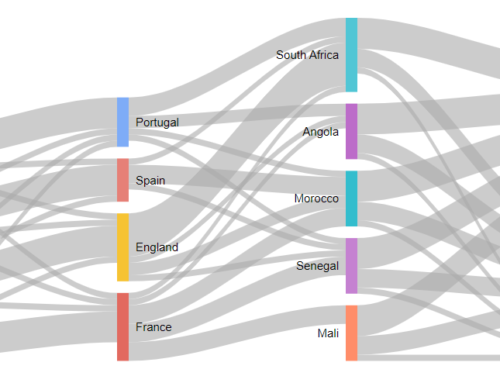
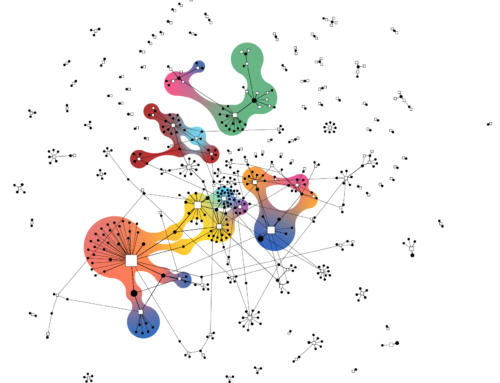
Visualizations are an effective way to communicate complex data and insights in a clear and concise manner to stakeholders such as marketing teams, executives, and clients. They help identify trends, patterns, and outliers that might be difficult to discern from raw data or tables and enable marketers to make data-driven decisions by providing a quick and intuitive way to understand the implications of marketing efforts and campaigns. Additionally, visually appealing and interactive dashboards can increase engagement with data, encouraging users to explore and interact with the information presented.
Using Tableau for marketing analytics visualizations:
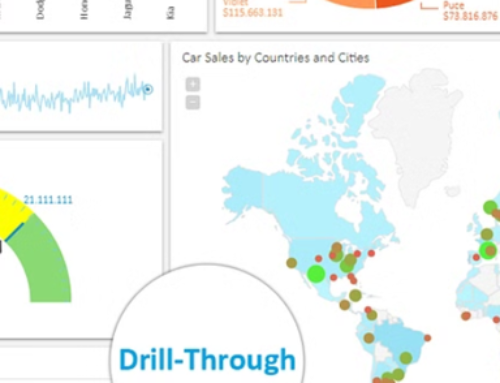
- Dashboards: Tableau allows users to create interactive and visually appealing dashboards that combine multiple data sources and visualizations, providing a comprehensive view of marketing performance.
- Customization: Tableau offers a wide range of customization options, enabling users to create visualizations that align with their brand guidelines and effectively communicate their message.
- Data Connectivity: Tableau can connect to various data sources, including marketing platforms, CRM systems, and databases, allowing for the integration and analysis of diverse marketing data.
https://www.tableau.com/learn/articles/data-visualization
https://help.tableau.com/current/pro/desktop/en-us/getstarted_buildmanual_ex1basic.htm
Using SPSS for marketing analytics visualizations:
- Statistical Charts: SPSS provides a variety of statistical charts, such as bar charts, line graphs, and scatterplots, which can be used to visualize marketing data and demonstrate relationships between variables.
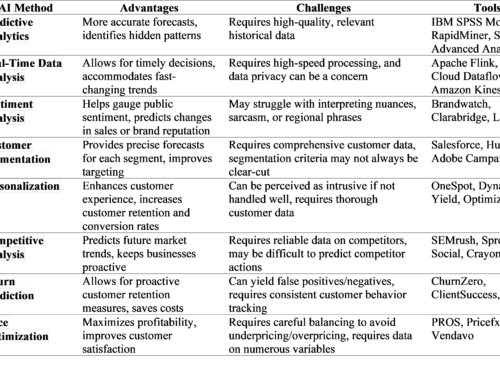
- Predictive Analytics: SPSS offers advanced statistical analysis tools, including predictive modeling, which can help marketers visualize future trends and outcomes based on historical data.
- Integration with other Tools: SPSS can integrate with other marketing tools, such as Google Analytics and CRM software, to create comprehensive visual reports that combine data from multiple sources.
Both Tableau and SPSS are great tools that can help marketers create compelling visualizations to understand and communicate marketing data effectively, ultimately leading to better decision-making and improved marketing strategies.


